A game-changer for any organization

Benchmark Module

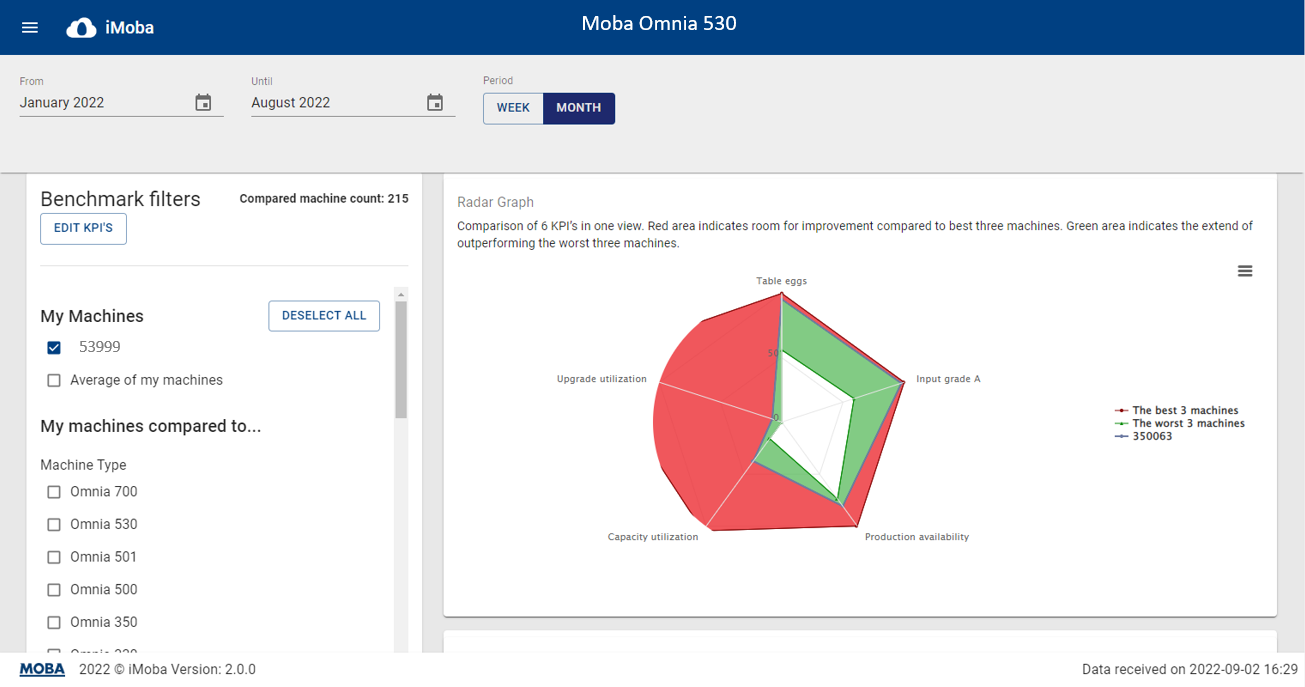
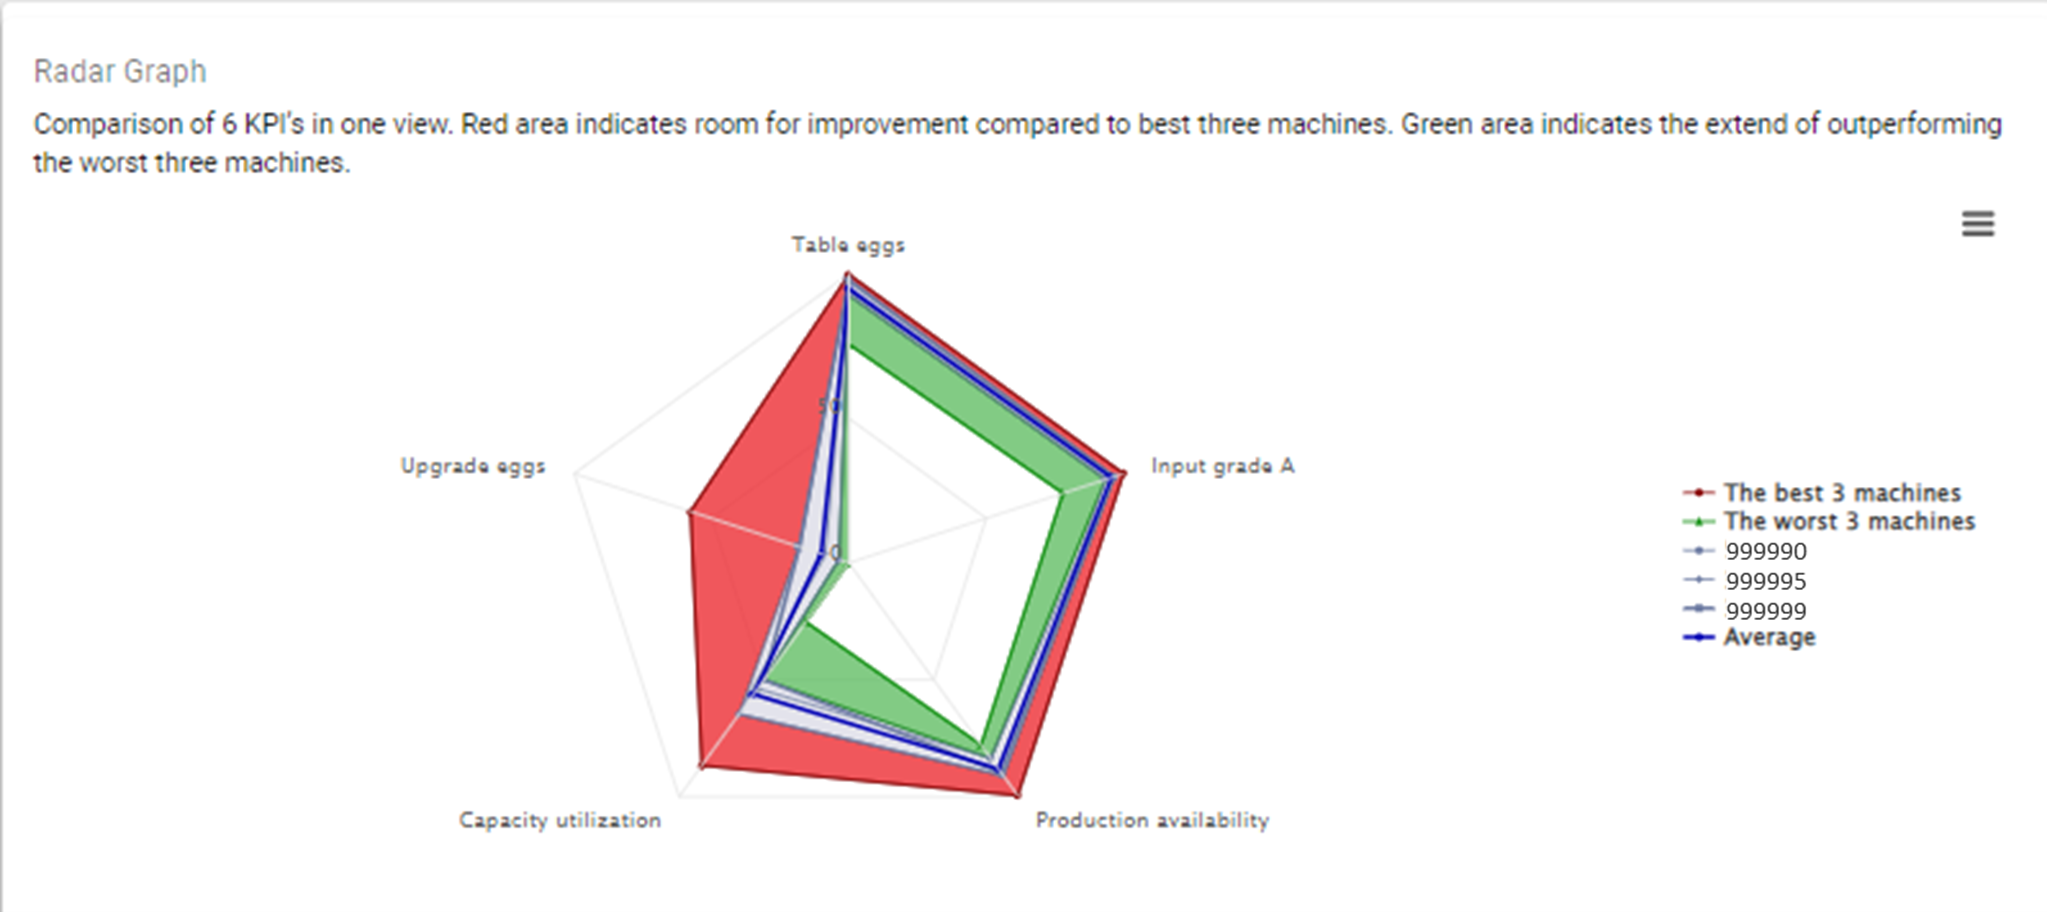
Introducing the Benchmark Module from the iMoba product line, a powerful tool designed to revolutionize your grader process performance analysis. While the Performance Pro Module helps you monitor day-to-day operations, the Benchmark Module takes it a step further by enabling you to set realistic targets through comprehensive performance comparisons with other iMoba users. This module is your key to identifying areas of excellence and pinpointing opportunities for improvement, ensuring you stay ahead in the competitive landscape.

Benchmark Module

Why Benchmarking Matters

The Benchmark Module leverages the 80–20 rule, emphasizing that significant gains come from improving below-average performance areas rather than focusing on aspects already performing well. By comparing your machine’s performance with others, you can quickly identify where you excel and where you need to improve. This targeted approach ensures that your efforts yield substantial results, making the Benchmark Module an indispensable complement to the Performance Pro Module.

Comparison Settings

The comparison settings section displays the number of machines in the group. By default, no filters are active, so this number represents the total number of connected iMoba machines. Users can apply various filters to refine their comparison, including:

  • Inline/Offline
  • Machine type
  • Production volume
  • Geographical location

To preserve the anonymity of the machines used for benchmarking, a lower limit of at least 10 machines per filter is specified. If the selected criteria result in fewer than 10 machines, the apply filter button is disabled, and the machine count turns red. Users must define less specific criteria to enable the apply button again, ensuring meaningful and anonymous comparisons.

Radar graph

The radar graph section allows users to visualize their machine’s performance across up to six axes, corresponding to selected KPIs. The average performance of your machine is illustrated alongside the three best and three worst performing machines in the comparison group. This visual representation helps users quickly identify areas of strength and opportunities for improvement. The KPIs that can be selected include system performance and egg quality indicators.

Benchmark Module
Benchmark Module

KPI Trend Charts

In the KPI trend chart section, users can track weekly or monthly trends for each selected KPI. The performance of your machine is compared to the best and worst performing machines in the comparison group, with color-coded highlights indicating areas for improvement. Green signifies positive performance, while red highlights potential areas for enhancement.

By analyzing these trends, users can make informed decisions to optimize their operations. For example, if the radar graph shows a lot of red in the upgrading KPI, users can delve deeper into the trend charts to understand the underlying factors and adjust their strategies accordingly.

The Benchmark Module is a game-changer for any organization looking to optimize its grader process performance. By providing detailed comparisons and highlighting key performance indicators, it empowers users to make data-driven decisions that drive significant improvements. Experience the full potential of iMoba and take your performance analysis to the next level with the Benchmark Module.